
For years, the final score was the only thing that mattered when anyone talked about a football match. But to really understand what happened on the pitch, you need to look at the process that led to that result. That's where modern statistics for soccer come in. These metrics tell the real story of how a team played, not just whether they won or lost.
How Statistics For Soccer Reveal Deeper Insights
Welcome to the new age of football analysis. The days of glancing at the league table and going with your gut are long gone. Today, the sharpest bettors and the biggest clubs are digging into the same advanced data to get a real handle on team performance, predict what might happen next, and find genuine value in the betting markets. The idea at the heart of it all is simple but incredibly powerful: the final score tells you what happened, but the performance data tells you why – and whether it’s likely to happen again.
Think of it like being a school teacher. A student's final exam grade is the result, but their homework, attendance, and mock exam scores are the performance data. You know that the student who works hard all term but has a bad day in the exam is still a good bet for future success. On the other hand, the student who crams last minute and gets lucky isn't someone you'd back to repeat that performance. Football is exactly the same.
Distinguishing Performance from Results
The biggest mental shift in modern analysis is learning to separate a team's performance from the final result. It happens all the time: a team can absolutely dominate a match, create a hatful of brilliant chances, and still end up losing 1-0 to a deflected shot. Looking only at the result, you’d just see a loss. But a data-driven approach sees a team that played brilliantly and was just unlucky. For a bettor, that distinction is everything.
By focusing on performance metrics, you can spot teams that are far better than their league position lets on. This is the secret to finding undervalued teams before the bookmakers and the public catch on.
Let's imagine a team loses three games in a row, all 1-0. On the surface, that's a team in a terrible slump. But what if the stats showed they were creating loads of great chances in every one of those matches while giving up very little at the back? A metric like Expected Goals (xG) would scream this from the rooftops. This team isn't playing badly; they're just having a rotten run of luck. It's an insight you'd completely miss if you only ever looked at the final score.
A quick look at the core metrics can give you an immediate sense of a team's style and quality. Here’s a simple table breaking down the key stats we'll be exploring.
Key Performance Statistics At A Glance
| Statistic | What It Measures | Primary Use in Betting |
|---|---|---|
| Expected Goals (xG) | The quality of scoring chances created. | Identifies teams over/underperforming their results. |
| Expected Assists (xA) | The quality of chances a player sets up. | Finds creative players whose value isn't on the scoresheet yet. |
| Shots & Shots on Target | The volume of attacking intent. | Gauges attacking pressure; useful for over/under goal markets. |
| Possession | Control of the ball. | Indicates which team is dictating the game's tempo. |
| Fouls & Cards | A team's disciplinary record and aggression. | Crucial for betting on card markets and identifying heated matches. |
This table is just a starting point. As we dive into each metric, you'll see how they connect to paint a much richer picture of what's really happening on the pitch.
The Power of Predictive Analytics
This way of thinking shifts your analysis from being reactive to proactive. Instead of just looking back at what's already happened, you start to anticipate what's going to happen. That’s why these performance metrics have become so indispensable. They help answer the questions that old-school stats never could:
- Which team is consistently creating the better goalscoring opportunities?
- Is that team's rock-solid defence a sustainable trend, or have they just been riding their luck?
- Who are the real creative sparks in a team, even if they aren't racking up goals and assists right now?
By getting comfortable with these deeper statistical concepts, you stop guessing and start making properly informed judgements. This guide will walk you through exactly how to use the key statistics for soccer you'll find on StatsHub to see beyond the scoreboard and analyse the beautiful game like a true expert.
Understanding Expected Goals And Assists
If you've spent any time around modern football talk, you've definitely come across the term Expected Goals, or xG. It might sound like a statistician's dream, but the idea behind it is actually quite simple and, for bettors, incredibly powerful. It’s the metric that helps us see past a fluky result and understand who really played better.
So, what is it? In short, Expected Goals gives a value to every shot taken in a game, telling you the probability of that shot actually becoming a goal. This isn't guesswork; the value is calculated by comparing that shot to tens of thousands of similar ones from a massive historical database.
Let's put it into context. A penalty kick is obviously a fantastic chance to score. From 12 yards out with only the keeper to beat, a pro is expected to score most of the time. That’s why a penalty has a high xG, typically around 0.76 xG – meaning it's converted 76% of the time. On the other hand, a wild shot from 40 yards out through a crowd of defenders has almost no chance. Its xG might be a tiny 0.01, reflecting just how poor that opportunity was.
When you add up the xG value of every single shot a team takes, you get their total xG for the match. This number paints a much richer picture than a basic stat like "shots on target" ever could.
Key Takeaway: xG doesn't just count chances; it measures their quality. It tells the story of who should have won the match based on the opportunities they created, not just the final scoreline.
This infographic shows how good passing and creative assists all feed into creating those high-quality goalscoring chances.
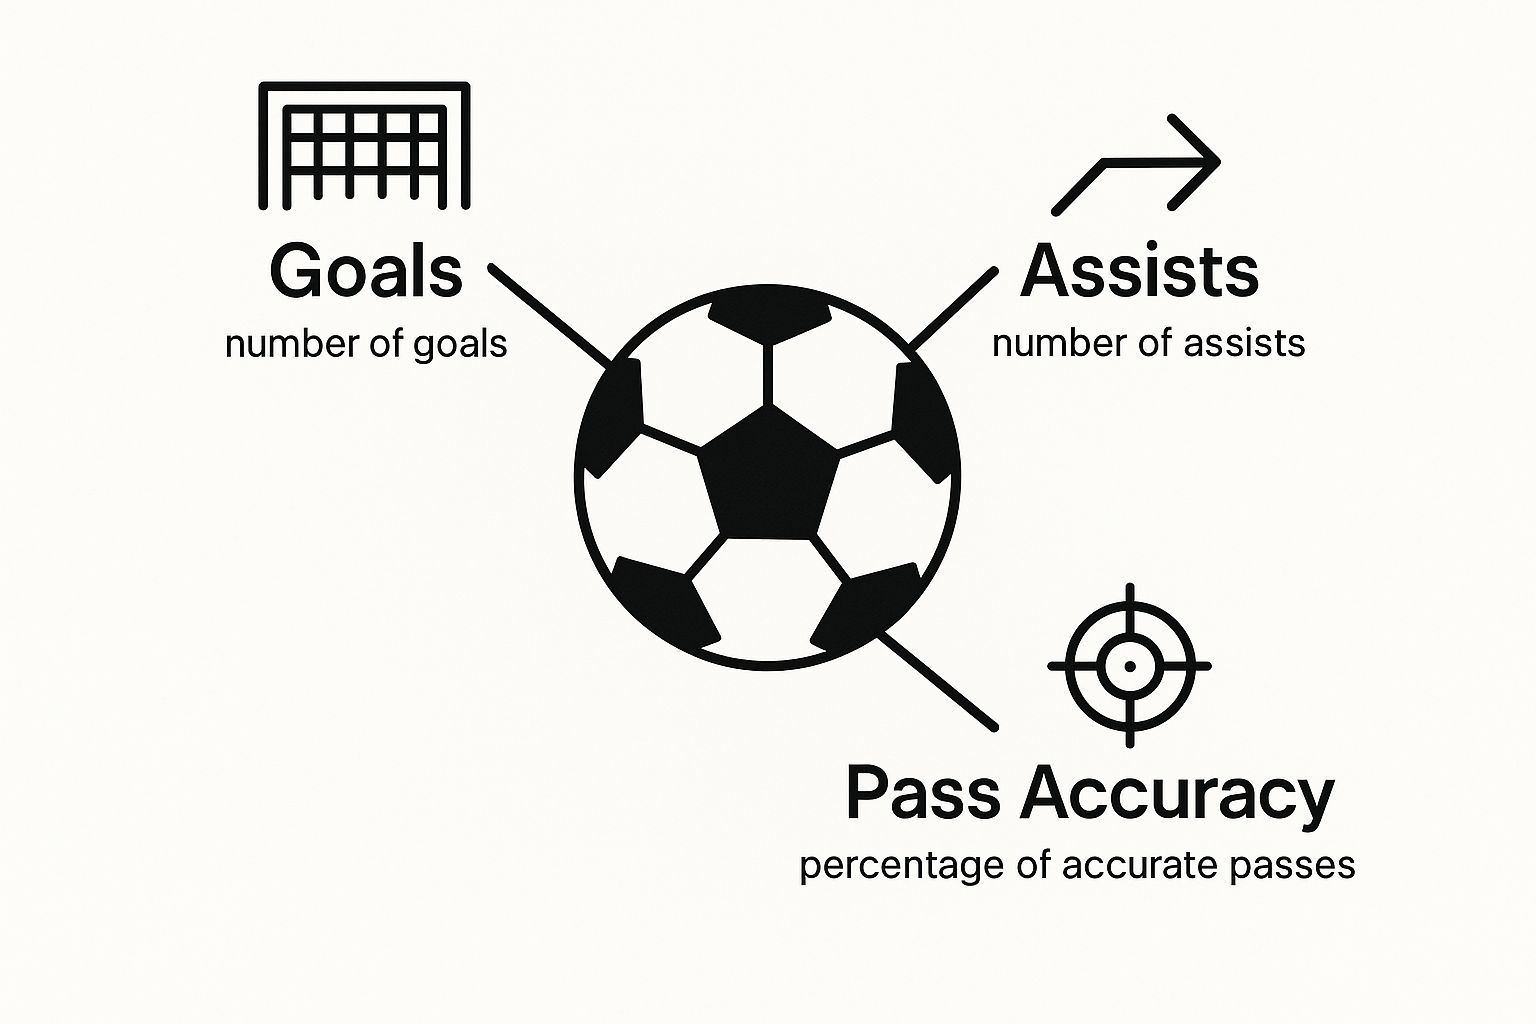
2f54b320-dd46-42e3-9c94-f35a95a5c37f.jpg
As the image suggests, a successful attack is a chain of events. Accurate passing leads to assists, which in turn create the kind of chances that win football matches.
Finding Value with xG Overperformance and Underperformance
This is where it gets really interesting for bettors. By comparing a team's xG to the number of goals they actually scored, you can spot teams that are either ruthlessly efficient or frustratingly wasteful. It’s one of the most fundamental concepts in modern football analysis.
- Underperformance: See a team with a high xG but very few goals to show for it? That team is underperforming. They're doing the hard part – creating golden opportunities – but are being let down by poor finishing or just plain bad luck. This pattern often corrects itself, making these teams fantastic candidates for finding betting value before the market catches on.
- Overperformance: On the flip side, a team scoring lots of goals from a low xG is overperforming. They might be riding a wave of luck, with wonder-strikes, deflected shots, and goalkeeping howlers going their way. While exciting to watch, this is rarely sustainable. These teams are often "due for a fall" and might be overvalued by bookmakers.
For a more detailed look at the mechanics, check out our guide on Expected Goals explained. Inside StatsHub, you can easily track a team's xG trends over multiple games to see these patterns forming.
Introducing Expected Assists (xA)
If xG grades the shooter, then Expected Assists (xA) grades the creator. This metric looks at every pass that leads to a shot and measures the probability of it becoming an assist. It works by simply assigning the xG of the resulting shot to the pass itself.
Imagine a midfielder plays a perfect defence-splitting pass to a striker, who now only has the keeper to beat. That's a high-xG chance. For that brilliant pass, the midfielder earns a high xA value, whether the striker fluffs his lines or not.
xA is your tool for identifying the true creative forces in a team. A player might have few official assists but a very high xA, telling you they are consistently putting chances on a plate for their teammates, only for the forwards to miss. These playmakers are often the hidden engine of a team's attack. By combining xG and xA, you get a complete, 360-degree view of a team's offensive health.
While Expected Goals (xG) gets most of the glory in modern football analysis, a couple of other stats you see everywhere—possession and total shots—can tell you just as much, provided you know how to read them. Looking at them at face value can be a real trap. The difference between a casual fan and a sharp bettor often comes down to understanding the story behind these numbers.
A team with 70% possession looks dominant on the surface, right? But that number tells you nothing about where they had the ball or what they were doing with it. Were they patiently carving out chances and pinning their opponent deep in their own half? Or were they just knocking it around between their centre-backs, going nowhere fast? This is the crucial difference between purposeful possession and sterile domination.
It’s entirely possible for a team to control the ball for most of the match without ever looking like scoring. They might boast a sky-high pass completion rate, but if none of those passes actually breaks a defensive line or finds a player in a dangerous area, the possession is pretty much meaningless. Context is everything.
Looking Deeper Than Just Possession
To get a real feel for how much control a team actually has, you need to dig into some supporting stats. This is where a platform like StatsHub comes in handy, giving you the tools to see what’s really going on.
When you see a high possession number, check these metrics alongside it:
- Final Third Entries: How often is the team actually getting the ball into the business end of the pitch? This signals real intent.
- Touches in the Opposition Box: This is a fantastic indicator of genuine attacking pressure. A team that's constantly getting touches inside the opponent's penalty area is far more threatening than one passing it around on the halfway line.
- Progressive Passes and Carries: These stats are brilliant because they filter out all the sideways and backwards passing, showing you only the runs and passes that move the ball significantly closer to the goal.
By layering these data points over the basic possession percentage, you can quickly figure out if a team is turning their time on the ball into a real threat, or if they’re just all style and no substance. It’s a simple way to avoid getting suckered in by teams that look good on paper but lack a killer instinct.
Decoding Shot Volume And Quality
Just like possession, the total shots stat can easily lead you astray. A team that takes 25 shots might sound like they were laying siege to the goal, but the quality of those shots is what really matters. This is where everything circles back to the concept of xG.
Picture a team getting frustrated by a "park-the-bus" defence. They can't find a way through, so they start taking potshots from 30 yards out. These all add to the shot count, but each one has a tiny xG value and is incredibly unlikely to beat the keeper.
A high volume of low-quality shots is often a sign of tactical frustration, not dominance. It tells you a team can't create clear chances and is resorting to hopeful punts from bad positions.
On the flip side, a team that only has 8 shots but racks up a high total xG has been clinical and efficient. You can bet that most of those attempts were high-quality chances created from prime spots inside the box. These are the teams with a clear, effective game plan.
So, when you look at shot data, ask yourself two simple questions:
- Where are the shots from? Are they clustered inside the penalty area or sprayed from all over the park?
- What’s the average xG per shot? Just divide the total xG by the number of shots. This gives you a fantastic snapshot of the average quality of each chance they create.
This level of detail takes your analysis from just counting shots to truly evaluating a team's ability to create danger. And if you're looking at player markets, diving into detailed Opta player stats can show you which players are consistently getting high-quality shots, even if they aren't finding the back of the net. That’s how you spot a player who is due a goal—and find some excellent betting value.
Getting to Grips with Defence and Discipline

51b94426-f336-4bf2-a9cd-cc8abb88c139.jpg
While flashy attacks and big xG numbers tend to steal the show, anyone who's been around football for a while knows the old wisdom holds true: defence wins championships. For bettors, getting a handle on the defensive side of the game isn't just an option; it's essential for seeing the complete picture of a team's real strength. It's also where you'll find some of the most interesting betting markets. Analysing statistics for soccer goes far beyond just tallying up goals conceded.
The truly great defensive sides are proactive. They don’t just sit back and wait for the opposition to come at them; they actively break up play and dictate the terms of engagement. The key stats to look at here are tackles, interceptions, and clearances. A high volume of tackles and interceptions often signals a team that likes to press high up the pitch, aiming to win the ball back in the other team's half. On the flip side, a team racking up loads of clearances probably prefers to sit deep, absorb pressure, and hoof the ball to safety. Neither way is inherently right or wrong, but knowing a team’s style is vital for predicting how a match will play out.
What Fouls Can Tell You
A team’s foul count tells its own fascinating story. Your first instinct might be to see a high foul count as a negative—a sign of a clumsy or ill-disciplined defence. But that's not always the full story. It could actually be the sign of a well-drilled, high-intensity pressing game, where players commit "tactical fouls" to stop counter-attacks before they ever get started.
What you really need to watch out for is where the fouls are happening. If a team is constantly giving away free kicks deep in their own half, that’s a massive red flag. It suggests a defence that's scrambling, being pulled out of shape, and forced into desperate, last-ditch challenges.
A team's disciplinary record is a direct window into its temperament and tactical approach. Analysing yellow and red cards can unlock significant value, especially in player-specific prop bets and in-play markets where tensions are high.
The Real Impact of Cards and Context
For bettors, disciplinary records are an absolute goldmine. The most obvious angle is the "player to be carded" market. By checking a player’s history on StatsHub—especially for aggressive midfielders or hard-tackling full-backs—you can quickly spot the usual suspects. But the real edge comes from adding context:
- The Matchup: Is it a heated local derby? These games are famous for boiling over, which almost always means more cards.
- The Referee: Some refs are notoriously card-happy, while others prefer to let the game flow. A quick look at a referee's average cards per game is a crucial bit of pre-match homework.
- Home-Ground Advantage: Never underestimate the influence of a roaring home crowd. The deep-rooted passion of supporters can sometimes sway officials. The history of UK football grounds, where some attendance records were set during the era of packed terraces, speaks volumes about this influence. In a quirky twist of history, some clubs like Manchester United even set their record attendances at rival grounds while their own was being redeveloped. You can dive deeper into the history of English football's record attendances on Wikipedia.
By pulling all these defensive and disciplinary stats together, you start to build a much more detailed and reliable profile of a team. You'll have a sense of not just how they score, but how they stop the opposition, and how they react when the pressure is on—all vital ingredients for placing smarter, better-informed bets.
Turning Soccer Statistics Into A Winning Bet
Knowing what xG or possession means is a great start. But the real art is piecing these stats together to build a compelling story of how a match might play out before a ball is even kicked. This is the leap from casual fan to sharp bettor—turning numbers into a clear, pre-match thesis. It’s all about creating a narrative based on solid evidence, not just a gut feeling.
Let's walk through a realistic example. Imagine Team A, a solid mid-table side, is playing at home against Team B, who are currently top of the league. On the surface, the bookies have Team B as heavy favourites, and most people would agree. But a proper dig into the statistics for soccer might just tell a completely different story.
By using StatsHub to pull up recent performances, you can build a statistical profile for each club. This lets you put their strengths and weaknesses head-to-head, moving beyond league position and reputation.
Creating A Pre-Match Statistical Profile
A good analysis isn't just about grabbing random stats; it's a structured process. Here’s a simple checklist I run through before I even consider looking at the odds:
- Check the xG Trend: Look at the last 5-10 matches. Is Team A (our underdog) consistently creating high-quality chances (high xG) but just not finding the back of the net? That screams bad luck, not bad performance.
- Analyse Possession Style: Does Team B (the favourite) love to dominate the ball? Fine. But check their final third entries and touches inside the opposition's box. If those numbers are low, all that possession is just neat, tidy, and utterly toothless.
- Identify Defensive Vulnerabilities: How does Team A typically concede goals? If they're solid through the middle but vulnerable to crosses, and you see that Team B's main strength is attacking from wide areas, you've just spotted a critical tactical mismatch.
- Examine Disciplinary Records: Is this a heated local derby? Is the referee known for being card-happy? If one team commits a lot of tactical fouls, the card markets could offer fantastic value.
Laying these trends out side-by-side often reveals a narrative the odds aren't pricing in. Maybe Team A's underlying numbers are fantastic despite a string of poor results, while Team B has been riding a wave of good fortune and outperforming their xG. This is exactly where you find value.
The entire point of statistical analysis is to spot the gap between what the market thinks will happen and what the data suggests is likely. When a team's strong process isn't showing up in their results yet, you've found a potential edge.
This kind of deep dive can lead you to far more interesting bets than just the match winner. For instance, if your research shows both teams create plenty of chances but are also defensively leaky, the 'Both Teams to Score' market suddenly looks very appealing. For those wanting to explore more advanced angles, our guide on handicap betting in football offers some great alternative strategies.
The Influence Of The Crowd
Finally, never forget the human element—especially the home crowd. The noise and passion of a packed stadium can lift players and put pressure on referees, adding a crucial layer of context to your numbers.
The Premier League is a perfect example. During the 2021/22 season, the total attendance broke 15 million for the first time, a figure you can verify on the official Premier League statistics page. That kind of ferocious home support can be the catalyst an underdog needs to finally turn their strong underlying stats into a massive result on the pitch.
Common Pitfalls When Using Soccer Statistics

7bca12a9-1cfd-451d-bc51-275fb5044a78.jpg
While statistics for soccer can give you a serious edge, treating them as gospel is a quick way to drain your betting account. Think of data as a powerful tool, not a crystal ball. Knowing its limits is just as vital as understanding what it tells you.
The most common mistake is searching for a single ‘magic bullet’ stat that supposedly holds all the answers. It’s tempting to look at a high xG and assume you’ve found a hidden gem, but football is far too complex for that.
Good analysis is all about piecing together a mosaic of evidence. A team’s massive xG in one match might just be a fluke. Perhaps they were chasing a three-goal deficit against a team that went down to ten men. It doesn't automatically brand them as the next offensive powerhouse. You always have to ask why the numbers look the way they do.
Take possession, for instance. A team might have 70% possession, which sounds incredibly dominant. But if it’s just their centre-backs knocking the ball between themselves miles from the opposition's goal, that's just sterile domination. It points to a team that can’t break down a determined defence, not a superior attacking force. Always cross-reference possession with stats like final third entries or touches in the opposition box to get the real story.
Ignoring The Importance Of Sample Size
One of the biggest traps you can fall into is making grand judgements based on a tiny amount of data. A team might smash their xG numbers for three games running, but that’s not a trend. It’s just a hot streak, and it’s almost guaranteed to cool off.
Relying on small sample sizes is like judging a marathon runner based on their first 100 metres. To get a true feel for a team's underlying ability, you need to look at their stats over a much longer stretch—think at least 10-15 matches.
This larger data set helps to iron out the randomness of individual games. It smooths over the lucky deflections, the once-in-a-lifetime wonder goals, and the calamitous keeper errors to show you what a team can sustainably do.
The Overlooked Qualitative Factors
Finally, remember that numbers on a screen can never paint the full picture. They don’t measure team morale, the 'new manager bounce', or brewing dressing room drama. A team with incredible underlying stats can still fall apart if their star striker just had a major row with the gaffer.
This is exactly why a balanced approach is so important. You need to combine the hard data from StatsHub with these real-world, qualitative factors.
- Team News: Who’s on the injury list? Is a key player suspended?
- Managerial Changes: A new manager can completely flip a team's tactical identity overnight.
- Fixture Congestion: Is this their third match in seven days? Fatigue is a massive, often underestimated, factor.
- Crowd Influence: The roar of a home crowd is a genuine force. The growth of football attendance in the UK, from a few thousand in the 1890s to today's packed stadiums, highlights just how deeply fans are part of the game. For a fascinating look at this history, you can explore English football attendance figures over the decades.
By weaving together the 'what' (the statistics) and the 'why' (the human context), you start to think more critically. It's this complete approach that helps you sidestep the common pitfalls and use statistics for soccer to build a genuinely informed betting strategy.
Frequently Asked Questions About Soccer Stats
Even when you've got a handle on what each stat means, you'll naturally have questions about how to put it all together. It's one thing to know the definitions, but another thing entirely to use them to find an edge. Let's tackle some of the most common queries that come up when punters first start using statistics for soccer.
First things first, where do you even find this information? Luckily, getting your hands on quality data is easier than ever, and you don't have to break the bank. Websites like FBref and WhoScored are brilliant free resources. They offer a huge amount of information, from basic league tables right through to advanced metrics like xG and player heatmaps. They’re my go-to for a quick, solid overview of teams and leagues.
If you're looking to go a level deeper and analyse the game like the pros, platforms such as Wyscout and StatsBomb provide the kind of granular data that top clubs and professional analysts use. These are typically paid services, but for serious research, the depth they offer is incredible.
What Is The Most Important Statistic?
A question I hear all the time is: "Is xG the only stat that really matters?" The short answer is a definite no. While Expected Goals is a fantastically insightful metric, relying on it alone is a classic rookie error. The best analysis always comes from looking at the bigger picture.
Think of xG as the star striker on a team. It's powerful and can often be the difference-maker, but it can't win the game single-handedly. It needs support from the rest of the squad—all the other stats—to tell the full story.
You should always use xG alongside other data points. Look at it in combination with raw shot volumes, possession quality (like how often a team gets into the final third), and defensive actions to build a complete narrative of a team's performance. And crucially, always layer in the human element: team news, a manager’s tactical preferences, and player morale. It's this blend of hard data and real-world context that leads to the sharpest bets.
How Much Data Do I Need?
Another key question revolves around sample size. How many matches do you need to look at before the stats paint a reliable picture? While there isn't a single magic number, bigger is almost always better when you're trying to spot genuine trends.
Trying to draw firm conclusions from just one match is a dangerous game; a lucky deflection or a moment of madness can skew the numbers completely. As a solid rule of thumb, looking at a team's performance over their last 10-15 matches gives you a pretty dependable view of their current form and style. If you want to identify those longer-term, season-defining patterns, analysing data from half a season (around 19 matches in most major leagues) is an even stronger foundation for your analysis.
Ready to move beyond the final score and truly upgrade your betting approach? StatsHub.com gives you all the in-depth player and team statistics you need to analyse matches like a professional. Explore xG trends, player props, and defensive metrics across dozens of leagues, completely free. Find your edge and make smarter bets by visiting the StatsHub homepage today.